Back to Designs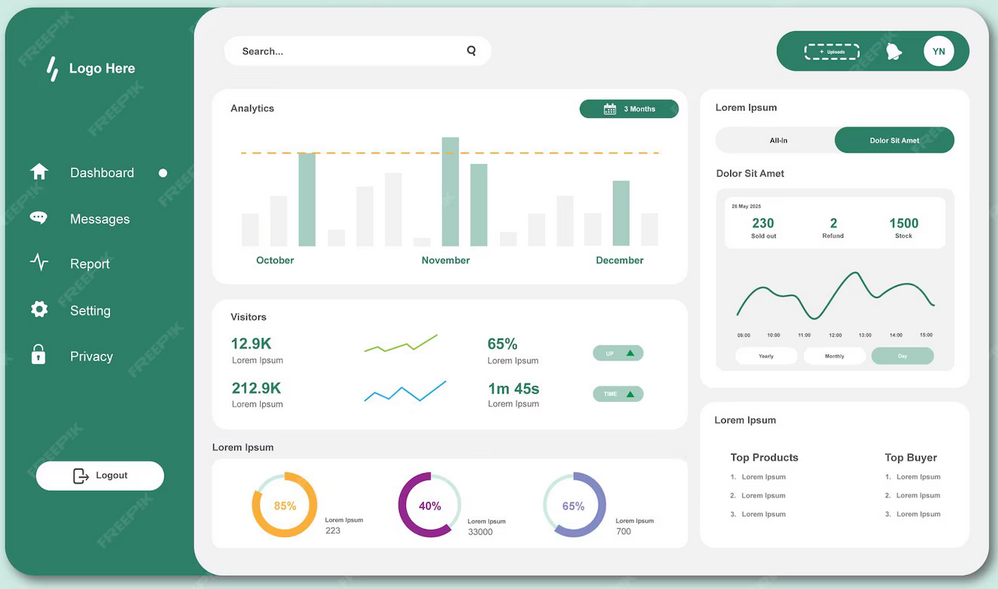
01Dashboard Design
Nebula Dashboard
Data Visualization Reimagined
A dark-mode analytics dashboard featuring real-time data visualizations, glassmorphism panels, and fluid gradient animations. Built for enterprises that demand beauty and performance.
24.5K
views
1.2K
likes
340
saves
2024
Year
About this design
Nebula Dashboard represents the pinnacle of data visualization design. Every pixel has been carefully crafted to create an immersive analytics experience. The interface combines cutting-edge glassmorphism effects with fluid gradients that respond to user interactions. Real-time data flows through beautifully animated charts, while the dark mode theme reduces eye strain during extended use. Built with performance in mind, the dashboard handles thousands of data points without sacrificing frame rates.
Key Features
Real-time data sync
Custom chart library
Keyboard shortcuts
Export to PDF/CSV
Tools Used
FigmaFramerAfter Effects
Tags
DASHBOARDDARK MODEANALYTICS